
 Buyer protection

Research on donkey milk · Study 113
Milk miRNA on the computer: donkey, human, cow, goat
From 29 public sequencing data sets, including 4 from donkey milk, 1549 conserved miRNAs were recorded. miR-148a-3p made up the largest share in all four types of milk, on average about 21.5 %.
At a glance · swipe or use the arrows
The key figures
Study design
How it was studied
A purely computational analysis without the authors’ own samples: publicly deposited sequencing data on small RNAs from 29 milk or milk cell samples from human (n = 8), cow (n = 13), goat (n = 4) and donkey (n = 4) were reanalysed uniformly. The four donkey samples come from two published comparative studies on milk vesicles from livestock. The miRNAs were quantified against human reference sequences, so only miRNAs conserved between species were captured. For each human gene, a score weighted by miRNA abundance was calculated per type of milk from predicted and experimentally supported miRNA–gene pairs from two public databases; genes were divided into 16 categories according to the ratio of the scores. The analysis included enrichment analyses, permutation and sensitivity tests and cluster analyses of the individual samples. The authors take uptake of the miRNAs via food as a purely working assumption.
Interactive chart · values from the study
Largest gene categories in the target gene profile
Table 1 of the study; the six smallest categories (224 genes together) are not shown. Computational predictions, not measurements in cells or humans.
Second analysis
Cumulative share of the most frequent miRNAs
Rounded values from section 2.1 and Figure 1A; top 1 is miR-148a-3p.
Results
What the study measured
Across all 29 data sets, 1549 conserved miRNAs were found, 456 of them in all four types of milk. The spectrum was strongly concentrated on a few miRNAs: miR-148a-3p was the most frequent miRNA in every type of milk (on average about 21.5 %), the five most frequent made up about 42.5 % and the 20 most frequent about 73.7 %. The composition of the 15 most frequent miRNAs was similar between species and differed mainly in quantity.
After noise filtering, 4577 predicted target genes remained. 1809 of them (39.5 %) formed a shared core with similarly high scores in all four types of milk; with 770 genes (16.8 %), the donkey-related category was the second largest, followed by the human-related one with 430 genes.
In the permutation test, the size of the donkey category, at 770 genes, was well above the random expectation of 325 ± 16 (p < 0.001). The scores of cow and goat correlated most strongly (ρ = 0.93), those of donkey and human most weakly (ρ = 0.67).
In principal component and cluster analysis, the 29 individual samples grouped by species (mean silhouette width 0.82); donkey milk was the most clearly separated from the other types of milk. The category structure remained stable at thresholds between 1.3 and 2.0.
Data quality was uneven: in the samples from one source project, 59.5–76.6 % of reads could be mapped to human references, but in the donkey sample from the second project only 6.68 %. According to the authors, the donkey spectrum remained practically unchanged without this sample (ρ = 0.99).
The authors explicitly described the enrichment analyses as hypothesis-generating. For genes in the shared core, they noted a methodological bias: these are targeted on average by 15.3 rather than 8.1 miRNAs, which favours enrichments.
Authors’ conclusion: In the view of Zoziuk et al. (2026), the predicted target gene profile of miRNAs from human, cow, goat and donkey milk is based on a large shared core shaped by a few frequent miRNAs such as miR-148a and the let-7 family; on top of this are species-specific patterns, among which the donkey-related group is the second largest. The authors stressed that these are computational predictions under the assumption of uptake via food that do not constitute experimental confirmation, and regarded their data as a basis for future laboratory experiments.
Critical assessment
Strengths and limitations
Computer predictions onlyClear limitation
The study measures no effect. It assumes that miRNAs from milk are taken up and regulate genes in human cells – an assumption that, according to the authors themselves, is scientifically disputed. No statements about effects in humans can be derived from it.
Only four donkey samplesClear limitation
The donkey data are based on four data sets from two earlier projects, one of them with a very low mapping rate (6.68 %). Breed, lactation stage and processing differ between the source data sets and are listed only in the appendix.
Conserved miRNAs onlyNote
Because all reads were evaluated against human references, donkey- or ruminant-specific miRNAs are missing. According to the authors, this means that the species-specific differences in particular are underestimated.
Mixed source samplesNote
The data sets include mature milk, colostrum (ten of the 13 cow samples) and milk fractions or milk cells, isolated with different methods. The data availability statement also mentions three GEO series that are not assigned in the sample description of the methods section.
Self-defined thresholdsNote
Categories are created via freely chosen limits (1.5-fold difference, 60th percentile). Mean scores and fold changes in Table 1 are based only on the 50 strongest genes per category, the gene counts on all 4577 genes.
Open and verifiableStrength
All source data are public, and intermediate results and code were provided. The authors test their classification with permutation and sensitivity tests and themselves name biases in the enrichment analysis.
Editorial assessment: The work is a computational analysis of previously published data and contains no milk samples of its own. It describes which conserved miRNAs were frequent in the data sets analysed and how computed target gene profiles differ between types of milk. No statements about effects on genes, cells or human health can be derived from it. To the research archive.
Research question for DON DONKEY’S®
Can the miRNA abundances from public donkey milk data sets be confirmed with freshly collected samples from different breeds and lactation stages and with donkey-specific reference sequences?
Original publication
Conserved Core and Species-Specific Signatures in the Milk Exosomal microRNA Targetome: A Preliminary Comparative In Silico Analysis of Human, Cow, Goat and Donkey Milk
Original title of the publication.
Zoziuk M., Djibagaou A.D., Terrinoni A., Koroliouk D., Colizzi V.
International Journal of Molecular Sciences · 2026 · 27(15), 6952
Department of Experimental Medicine, University of Rome Tor Vergata, Rome, Italy; Laboratoire des Grandes Epidemies Tropicales, Faculty of Medicine, University Hospital Complex “Bon Samaritain”, N’Djamena, Chad
10.3390/ijms27156952: 10.3390/ijms27156952
Transparency: Italian Cooperation Agency (AID 12582); additional support from the Interdepartmental Centre for Comparative Medicine, Alternative Techniques and Aquaculture (CIMETA) of the University of Rome Tor Vergata and the Faculty of Medicine of the Good Samaritan Teaching Hospital in N’Djamena, Chad. The authors declare no conflicts of interest. No product-related statement for DON DONKEY’S®.
Summarised and reviewed by the DON DONKEY’S editorial team on the basis of the original publication · as of October 2026
The study summarised above was carried out independently of DON DONKEY’S® and does not relate to our products. It serves solely to inform about the state of research.
DON DONKEY’S® donkey milk and donkey milk powder are foods. They are not intended to prevent, treat or cure any disease and do not replace medical advice.
From our shop
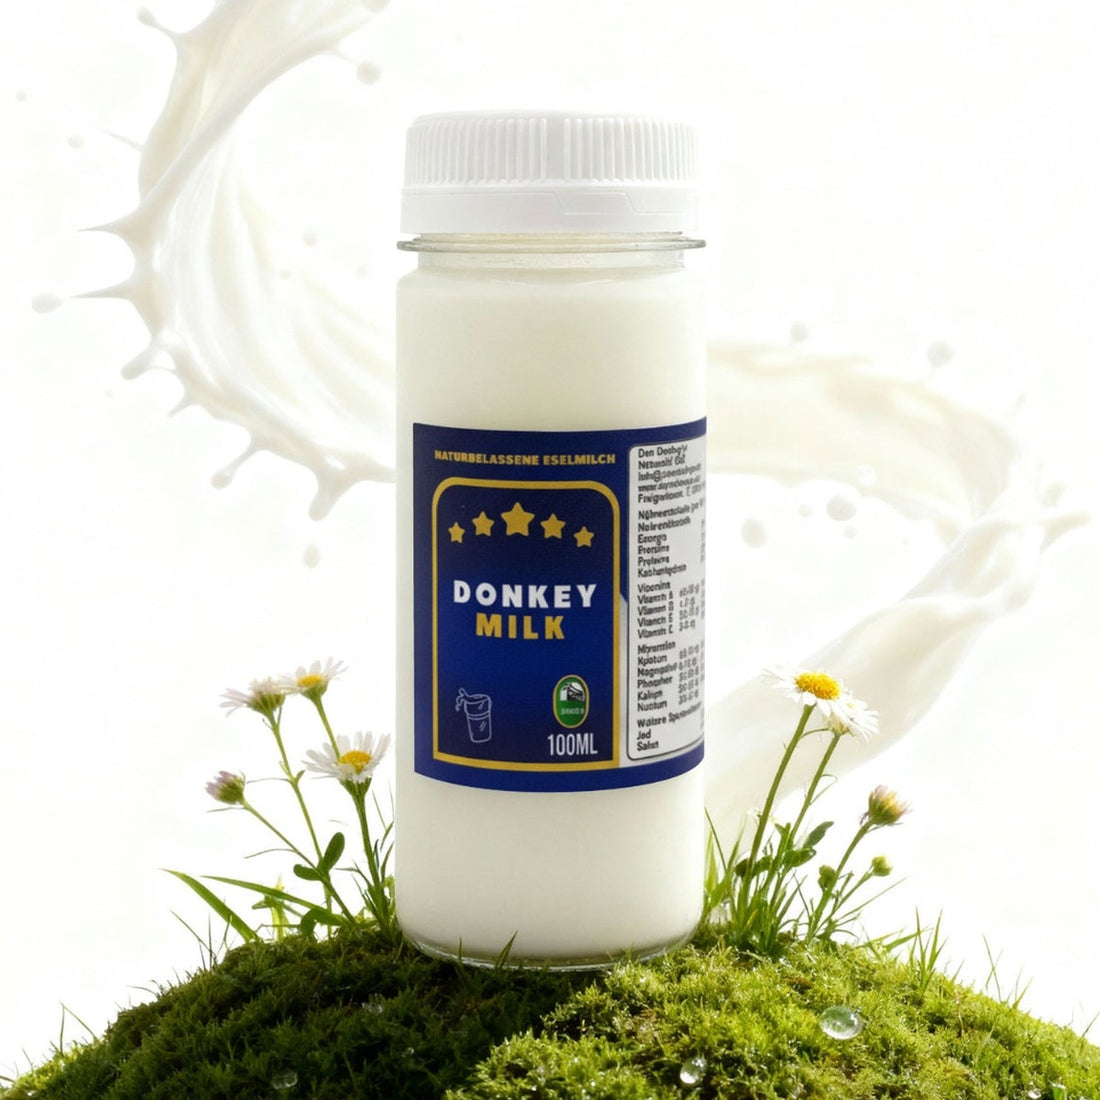
DON DONKEY’S® donkey milk
100 % donkey milk · raw milk, frozen
On this page we report the findings of a published study. Independently of that, you will find our donkey milk here: 100 % donkey milk, frozen as raw milk.
100 ml bottle / 100ml · Unit price: €249,00 / 1 l · incl. VAT, plus shipping
Also in our shop
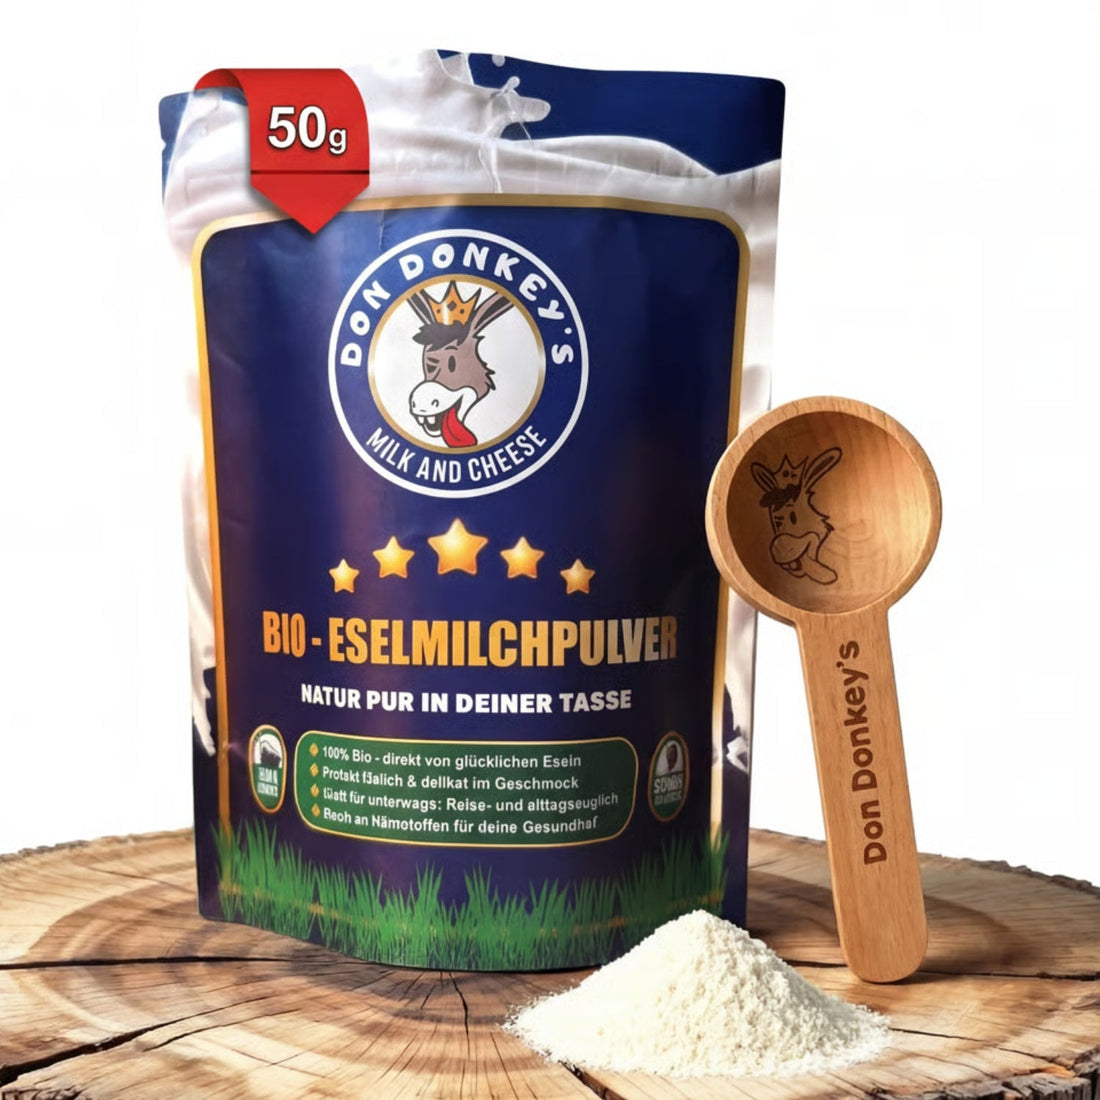
Donkey Milk Powder
Donkey milk in powder form
For anyone who prefers a longer shelf life: our donkey milk in powder form – easy to store and portion.
20g · Unit price: €1.245,00 / 1 kg · incl. VAT, plus shipping