
 Buyer protection

Research on donkey milk · Study 102
Polar lipids: donkey vs. bovine colostrum
In donkey and bovine colostrum, 206 polar lipids from 11 subclasses were recorded; 141 differed markedly. Sphingomyelin made up 70.7 % of the polar lipids in donkey colostrum and 50.9 % in bovine colostrum.
At a glance · tap the cards
The key figures
Study design
How it was studied
Colostrum from 30 Dezhou jennies (2–4 years, 0–5 days after birth, shared pasture on a farm near Dalian) was compared with colostrum from 30 Holstein cows (2–4 years, 1–5 days after calving, farm near Shenyang). For each species, the 30 samples were randomly combined into 10 groups of three samples each and analysed. The lipids were extracted with chloroform/methanol, the polar lipids separated by acetone precipitation and quantified by UHPLC triple quadrupole mass spectrometry in MRM mode with isotope-labelled internal standards. The analysis included PCA, OPLS-DA with permutation test, t-tests, fold-change filters (VIP > 1, p < 0.05, FC > 2 or < 0.5), correlation networks and metabolic pathway analyses.
Interactive chart · values from the study
Identified polar lipids by subclass
Number of lipid species identified per subclass in donkey and bovine colostrum combined (text and Figure 1B), not the amount of lipid. PE = phosphatidylethanolamine, PC = phosphatidylcholine, SM = sphingomyelin, PI = phosphatidylinositol, Hex2Cer = dihexosylceramide, CL = cardiolipin, Cer = ceramide, PA = phosphatidic acid, PG = phosphatidylglycerol, HexCer = hexosylceramide, PS = phosphatidylserine.
Second analysis
Shares of the main subclasses in the polar lipids
Values from the results text on Figure 1C; “Other” calculated editorially as the difference to 100 %. Shares within each milk – the absolute contents were higher in bovine colostrum in all subclasses.
Results
What the study measured
In donkey and bovine colostrum combined, 206 polar lipids from 11 subclasses were identified: 152 glycerophospholipids (73.79 %) and 54 sphingolipids (26.21 %). By number, phosphatidylethanolamines (70), phosphatidylcholines (33) and sphingomyelins (22) dominated.
By quantity, sphingomyelin was the largest subclass in both colostrums: 70.7 % of the polar lipids in donkey colostrum and 50.9 % in bovine colostrum. It was followed by phosphatidylethanolamine (13.6 % vs. 21.9 %) and phosphatidylcholine (8.89 % vs. 10.8 %).
In absolute terms, all 11 subclasses were significantly higher in bovine colostrum (p < 0.001). Only seven of the 206 individual lipids were higher in donkey colostrum, including four sphingomyelins.
PCA and OPLS-DA clearly separated the two colostrums (first principal component 94.1 %, second 4.6 %); the model was checked with cross-validation and 200 permutations.
141 polar lipids met the selection criteria, including 57 phosphatidylethanolamines, 23 phosphatidylcholines, 15 dihexosylceramides and 10 sphingomyelins; all were higher in bovine colostrum. The largest difference was shown by the cardiolipin CL 18:0/18:0/18:0/20:1 (fold change 224.855).
The 141 lipids correlated closely within the same subclasses (1398 correlations in donkey colostrum, 1525 in bovine colostrum). Of eight metabolic pathways assigned, the authors named six as the most relevant, above all glycerophospholipid metabolism.
Authors’ conclusion: In the view of Zhang et al. (2025), donkey and bovine colostrum differed clearly in their polar lipid profile: bovine colostrum contained more polar lipids overall, while sphingomyelin made up a larger share in donkey colostrum. The authors saw this as a basis for combining both types of milk in a targeted way in food processing; health effects were not examined.
Critical assessment
Strengths and limitations
Two farms, two species
Jennies and cows came from different farms with different feeding and a slightly different sampling period (0–5 vs. 1–5 days). Differences therefore cannot be attributed to species alone. How the three samples per group were combined is not described precisely.
Fold change defined inconsistently
According to the methods section, fold change is donkey divided by cow. Since all 141 lipids were higher in bovine colostrum, the values should be below 0.5; however, 224.855 is given as the highest and 3.4735 as the lowest value, apparently cow divided by donkey.
Counts not entirely consistent
According to the listing, the 141 lipids include no phosphatidylinositol, although this subclass was also higher in bovine colostrum. The abstract mentions six metabolic pathways, the conclusion eight; the multivariate analysis is attributed to different software in the methods and results sections. Figure 2 gives the unit as ng/mL with the addition (w/w).
Hardly any figures in the main text
Absolute concentrations are shown only in box plots, not tabulated; quantitative shares are given as numbers for only three subclasses. There is no figure for the total amount of polar lipids.
Interpretations not tested
The authors’ statements about the importance of individual lipids for development, energy metabolism or infant nutrition are based on the literature and were not examined in the study. It is purely a compositional analysis without any testing of effects in humans.
Quantitative, targeted method
The polar lipids were quantified in a targeted way in MRM mode with isotope-labelled standards, and 30 animals per species were included. The OPLS-DA model was validated by cross-validation and a permutation test.
Editorial assessment: The study describes analytically which polar lipids occur in colostrum from jennies and cows and how their shares differ. It concerns colostrum from the first days, not mature milk; no statements about effects or individual commercial products can be derived from it. To the research archive.
Research question for DON DONKEY’S®
Does the high sphingomyelin share of the polar lipids persist in mature donkey milk, and how does it change with different feeding and over the lactation?
Original publication
Lipidomics profile shows differences of polar lipids between donkey and bovine colostrum: a comparative study
Original title of the publication.
Zhang Y., Chen J., Liu Z., Zhang S., Wang J., Shao J., Yue X., Li M.
Food Chemistry: X · 2025 · 29, 102798
College of Food Science, Shenyang Agricultural University, Shenyang, China; State Key Laboratory of Dairy Biotechnology, Shanghai Engineering Research Center of Dairy Biotechnology, Shanghai, China; School of Life Sciences & Biotechnology, Shanghai Jiao Tong University, Shanghai, China
10.1016/j.fochx.2025.102798: 10.1016/j.fochx.2025.102798
Transparency: Natural Science Foundation of Liaoning Province (2023-BSBA-281) and Shenyang Agricultural University (Z20230586, H2024523). The authors declare no competing financial interests or personal relationships that could have influenced the work. No product-related statement for DON DONKEY’S®.
Summarised and reviewed by the DON DONKEY’S editorial team on the basis of the original publication · as of October 2026
The study summarised above was carried out independently of DON DONKEY’S® and does not relate to our products. It serves solely to inform about the state of research.
DON DONKEY’S® donkey milk and donkey milk powder are foods. They are not intended to prevent, treat or cure any disease and do not replace medical advice.
From our shop
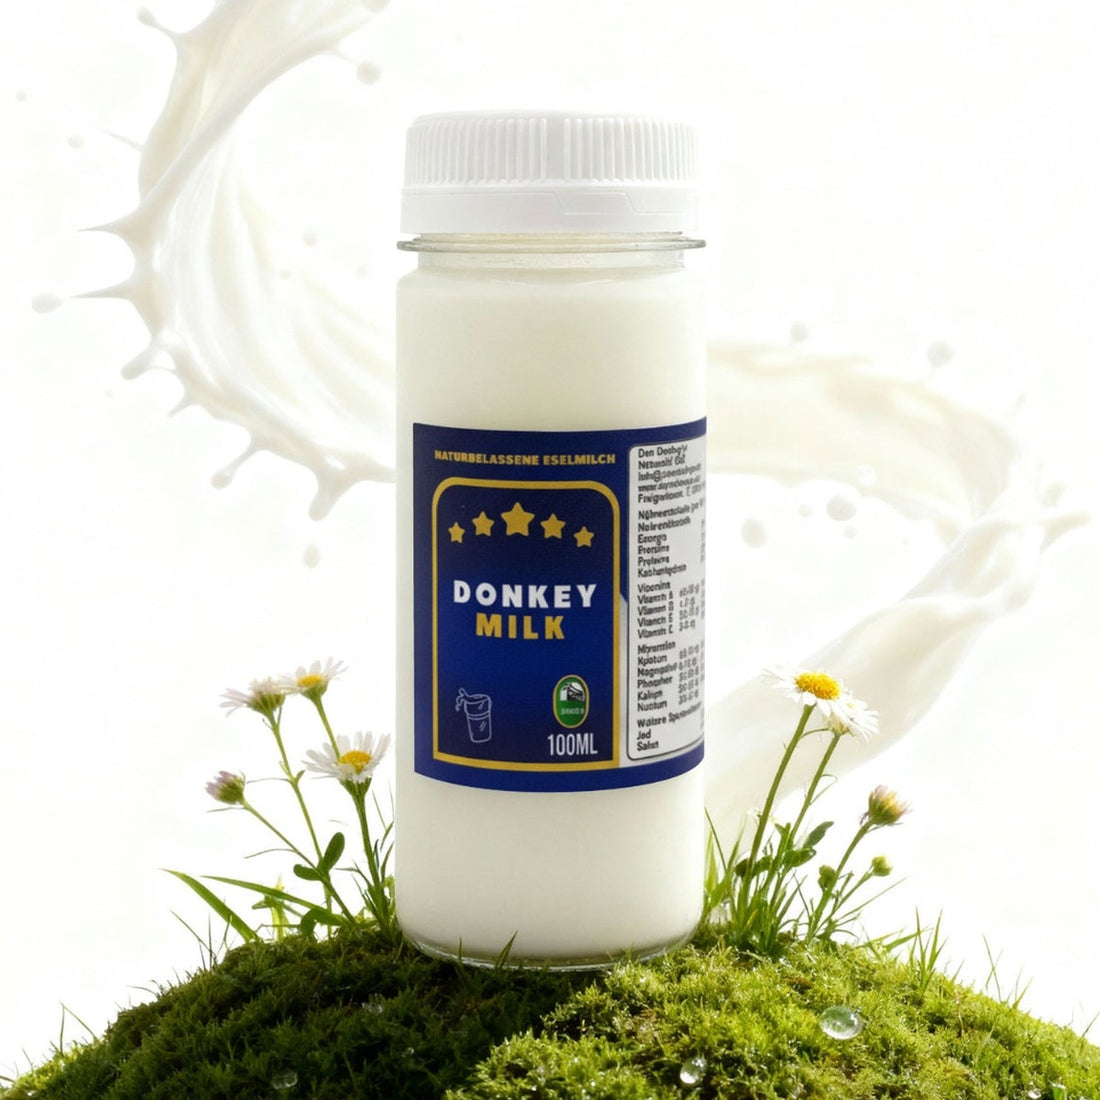
DON DONKEY’S® donkey milk
100 % donkey milk · raw milk, frozen
On this page we report the findings of a published study. Independently of that, you will find our donkey milk here: 100 % donkey milk, frozen as raw milk.
100 ml bottle / 100ml · Unit price: €249,00 / 1 l · incl. VAT, plus shipping
Also in our shop
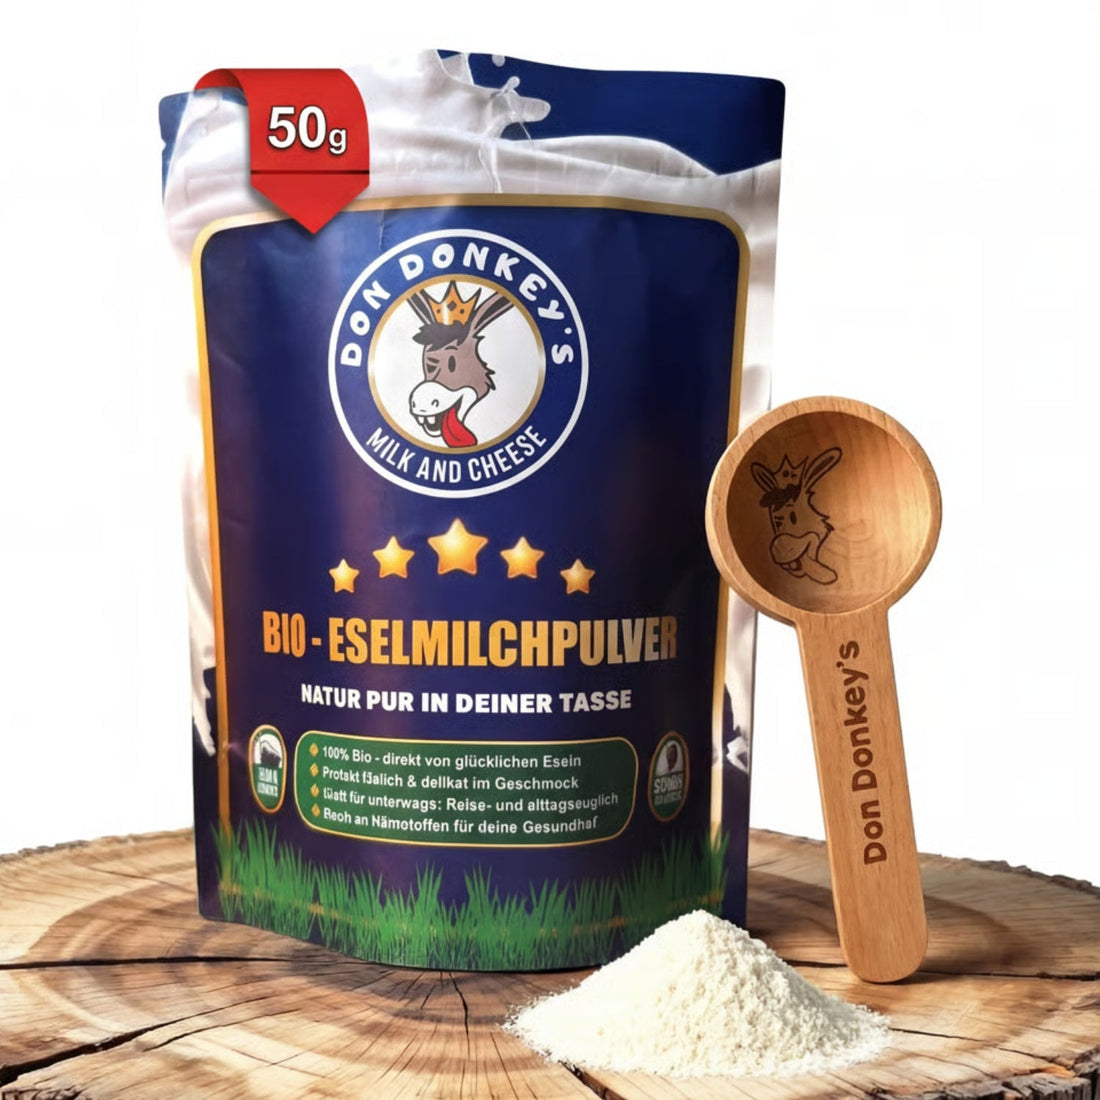
Donkey Milk Powder
Donkey milk in powder form
For anyone who prefers a longer shelf life: our donkey milk in powder form – easy to store and portion.
20g · Unit price: €1.245,00 / 1 kg · incl. VAT, plus shipping